Dynamical Modeling of Galaxy Mergers Using Identikit
G. C. Privon et al. (Accepted to ApJ)
arXiv preprint, ADS
Abstract: We present dynamical models of four interacting systems: NGC 5257/8, The Mice, the Antennae, and NGC 2623. The parameter space of the encounters are constrained using the Identikit model-matching and visualization tool. Identikit utilizes hybrid N-body and test particle simulations to enable rapid exploration of the parameter space of galaxy mergers. The Identikit-derived matches of these systems are reproduced with self-consistent collisionless simulations which show very similar results. The models generally reproduce the observed morphology and \HI\ kinematics of the tidal tails in these systems with reasonable properties inferred for the progenitor galaxies. The models presented here are the first to appear in the literature for NGC 5257/8 and NGC 2623, and The Mice and the Antennae are compared with previously published models. Based on the assumed mass model and our derived initial conditions, the models indicate the four systems are currently being viewed 175-260 Myr after first passage and cover a wide range of merger stages. In some instances there are mismatches between the models and the data (e.g., in the length of a tail); these are likely due to our adoption of a single mass model for all galaxies. Despite the use of a single mass model, these results demonstrate the utility of Identikit in constraining the parameter space for galaxy mergers when applied to real data.
Key Figures
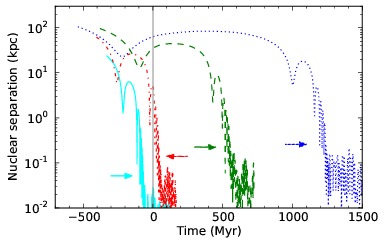
Figure 1:True nuclear separation as a function of time for NGC 5257/8 (dotted blue line), The Mice (dashed green), Antennae (dash-dot red), and NGC 2623 (solid cyan). Time of zero is the current viewing time (solid gray vertical line). The time since first passages for these systems is 175-260 Myr. Colored arrows mark the smoothing length in kpc for the corresponding system; this is effectively the spatial resolution of our simulations and the behavior of the curves on length scales smaller than the smoothing length is not reliable.
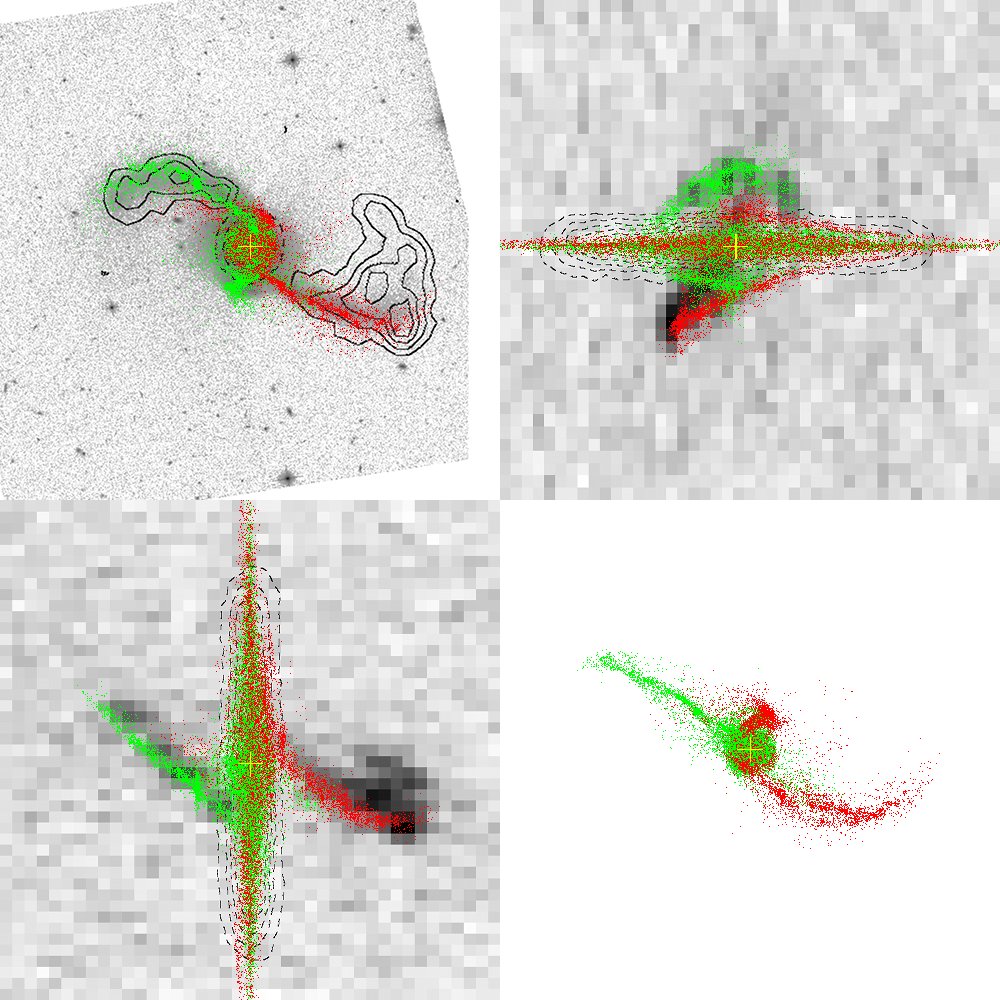
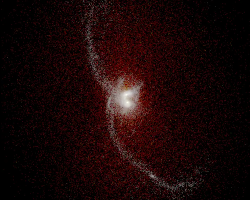
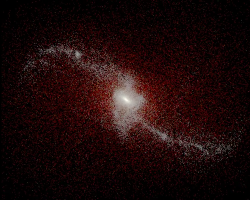
Figure 7:Identikit visualization of a self-consistent model for NGC 2623, matched to the system. (a): sky view of the system (RA-Dec), (b) PV diagram (v-Dec), (c): PV diagram (RA-v), and (d) ``top-down'' view (RA-redshift). The sky view shows the HST F814W image in grayscale (Evans+ 2008) and the HI in contours; it covers 77 kpc. The position velocity diagrams show the HI emission in grayscale and the HI absorption is shown as dashed contours. The velocity width is 470 km/s. In the relevant panels, the solid bar is 10 kpc and the box is 50 km/s. Red and green points correspond to stellar particles from N-body realizations of the two progenitor systems for NGC 2623 and the yellow cross denotes the nuclei of the N-body realizations.
The paper presents similar images for the other systems modeled.
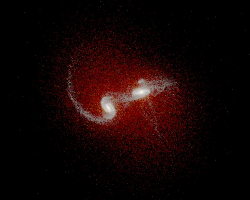
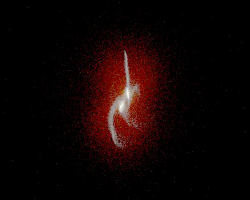
Videos
 |
NGC 5257/8
|
 |
The Mice
|
 |
Antennae
|
 |
NGC 2623
|